
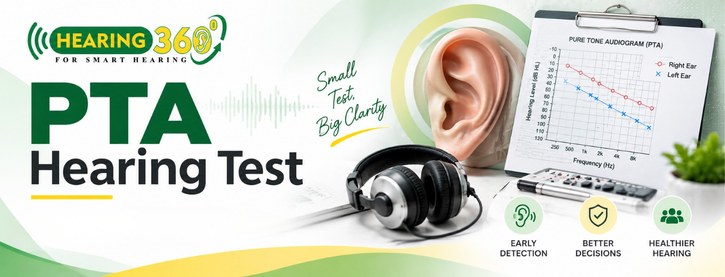
A PTA hearing test isn’t just about whether you pass or fail. It produces an audiogram, which is a graph that shows how your ears respond at different pitches and carries information that most people don’t learn to read.
Two people can walk out with the same overall hearing-loss category and still have completely different patterns underneath it.
This blog covers how to read that pattern, what different shapes commonly indicate, and where the graph stops being enough on its own.
How to Read a PTA Hearing Test Audiogram Beyond the Basic Number
An audiogram plots two things: frequency (pitch, measured in Hz) along the horizontal axis, and hearing level (loudness needed to detect a sound, measured in dB HL) along the vertical axis.
Lower on the chart means you need a louder sound to hear it, so a line further down represents worse hearing at that pitch.
Each ear gets its own line, usually marked with different symbols, because hearing loss rarely affects both ears identically.
A right-ear pattern that looks nothing like the left-ear pattern is itself a piece of information, not a plotting error.
What does a PTA hearing test actually measure?
It measures the quietest sound you can detect at several specific frequencies, typically from low pitches around 250 Hz up through high pitches around 8000 Hz. The result at each frequency is called a threshold.
When combined together, they form the shape of the audiogram, which is more informative than one averaged number.
This average is essential for distinguishing severity, like mild, moderate, or severe, but it may hide a lot of it.
A person mostly with normal low- and mid-frequency hearing and a high-frequency drop may fall in the ‘mild hearing loss’ category average. This is a person with flat, even hearing loss across different frequencies. The two, however, will experience hearing differently.
Air conduction and bone conduction
Most PTA testing includes both air conduction (sound through headphones, testing the whole hearing pathway) and bone conduction (sound through a vibrating device placed behind the ear, testing the inner ear directly, bypassing the outer and middle ear).
Comparing the two helps identify where in the ear a problem is likely sitting, which becomes relevant in the next section.
Why the gap between thresholds matters
When air conduction and bone conduction results are plotted on the same chart, the gap between them — sometimes called the air-bone gap- carries its own meaning.
A minor or no gap usually suggests the inner ear is handling sound normally, and any loss is most likely to be sensorineural.
A clear gap while air conduction thresholds are worse than bone conduction shows something interfering with sound travelling to the inner ear.
This single comparison, easy to miss if you’re only looking at the overall severity label, is often the first clue toward what’s actually happening in the ear.
What Different Hearing Loss Patterns on an Audiogram Can Reveal
The overall severity number tells you how much hearing is affected. The shape tells you more about where and, sometimes, why.
- Flat pattern: thresholds are roughly similar across low, middle, and high frequencies. This often shows up with certain types of conductive issues or general age-related change affecting the ear more evenly.
- Sloping pattern: hearing worsens as frequency increases, so high pitches are harder to detect than low ones. This is one of the more common patterns seen with noise exposure and age-related hearing decline, and it’s often why people say they can hear someone talking but not make out every word clearly.
- Rising pattern: this is the opposite of sloping — low frequencies are harder to hear than higher ones. This pattern is rare and mostly associated with particular inner-ear or middle-ear conditions.
- Notched pattern: a dip at one or two particular frequencies, usually around 3000 to 4000 Hz, with better hearing on both sides of the dip. This shape is usually connected to noise-induced hearing loss and needs professional evaluation instead of a quick read.
- Conductive, sensorineural, or mixed patterns: comparing air conduction and bone conduction results shows if the problem is in the outer or middle ear, indicating a conductive; the inner ear or hearing nerve for sensorineural; or both for a mixed pattern.
- One sided or two sided patterns: a difference in two ears points toward the reason affecting one ear like injury, infection, or blockage instead of the usual age-related process affecting both.
The shape is as important as the severity. A moderate slope and a moderate flat loss have the same average number but indicate different situations, usually the next steps.
What an Audiogram Cannot Tell You on Its Own
A PTA result is a strong starting point, but it has real limits, and it’s worth knowing them before assuming the chart tells the full story.
Speech understanding isn’t fully captured by tone thresholds. Detecting a beep at a certain volume is different from following a conversation in a noisy restaurant.
This is why speech audiometry, testing how well someone understands actual words, sometimes with background noise added, often gets used alongside a standard pure-tone assessment to get a fuller picture of everyday listening difficulty.
Middle-ear function isn’t directly shown either. If air and bone conduction results suggest a conductive component, impedance audiometry (tympanometry) can help clarify whether the eardrum and middle ear are functioning normally, which a pure-tone chart alone won’t confirm.
The same category affects people differently. Two people with an identical moderate sloping loss can report very different levels of daily difficulty, depending on their listening environments, occupation, and how long the change has been developing.
The audiogram describes hearing sensitivity; it doesn’t describe someone’s experience of hearing.
A few situations where it’s worth discussing next steps with a professional rather than reading the chart alone:
- A notched or one-sided pattern that hasn’t been explained
- Reported difficulty following speech despite a relatively mild average threshold
- Any suspicion of a middle-ear issue alongside the hearing test results
- A significant change in hearing since the earlier test

Tracking changes over time as important as a single reading
One audiogram is just one picture. In case you have had hearing evaluations before in the same area at the same frequencies, comparing results will reveal more than either test can.
A gradual downward shift in the past few years reads differently than an unexpected change within weeks.
Keeping copies of past reports, rather than only remembering the summary category, makes this comparison possible when it matters.
Reading the Pattern Is Only the First Step
An audiogram from a PTA hearing test gives you a real, specific picture of how each ear responds across frequencies, not just a single score.
Learning to read the shape, and not only the severity label, helps make sense of why two “similar” results can mean two different things.
But the graph is a starting point for a conversation, not a full diagnosis on its own.
If you’ve had this test done and want the pattern properly explained, including what it does and doesn’t tell you, a comprehensive hearing evaluation with Hearing 360 Degree can help connect the audiogram to what it actually means for your day-to-day hearing.
FAQs
What does a PTA hearing test show on an audiogram?
It shows your hearing thresholds — the quietest sound you can detect — at several frequencies for each ear, plotted as a graph. The pattern this forms reveals more than a single severity number alone.
What does a sloping audiogram mean?
A sloping pattern means hearing worsens at higher frequencies compared to lower ones. It’s commonly associated with noise exposure or age-related hearing changes, though a professional evaluation is needed to confirm the cause.
Can an audiogram show the type of hearing loss?
Yes, to an extent. Comparing air conduction and bone conduction results helps indicate whether the loss is conductive (outer/middle ear), sensorineural (inner ear/nerve), or mixed.
Why are both ears tested separately in PTA?
Because hearing loss doesn’t always affect both ears equally. Testing each ear independently can reveal one-sided patterns that point toward causes specific to one ear, such as infection or blockage.